


Next: About this document ...
Up: The NextGen Model Atmosphere
Previous: Tables
Figure:
Comparison between PHOENIX (full line) and
ATLAS9 (dotted line) model spectra in the UV for 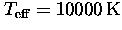 ,
, and solar abundances. The PHOENIX spectrum has been smoothed
with a Gaussian kernel to
and solar abundances. The PHOENIX spectrum has been smoothed
with a Gaussian kernel to  resolution.
 |
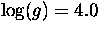
Figure:
Comparison between PHOENIX (full line) and
ATLAS9 (dotted line) model spectra in the UV for , and solar abundances. The PHOENIX spectrum has been
smoothed with a Gaussian kernel to  resolution. We also show the
PHOENIX spectrum at its original resolution scaled by a factor of 0.5
for comparison.
resolution. We also show the
PHOENIX spectrum at its original resolution scaled by a factor of 0.5
for comparison.
 |
Figure:
Comparison between PHOENIX (full line) and
ATLAS9 (dotted line) model spectra for 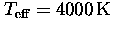 , and solar abundances. The PHOENIX spectrum was convolved with a Gaussian
kernel of width for wavelengths smaller than
, and solar abundances. The PHOENIX spectrum was convolved with a Gaussian
kernel of width for wavelengths smaller than  m and with a
Gaussian kernel of
m and with a
Gaussian kernel of  width for wavelengths larger than m.
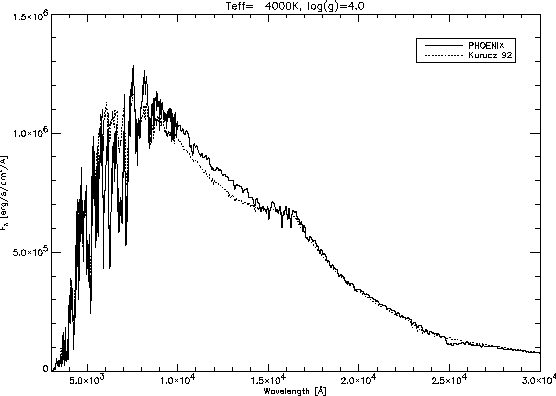 |
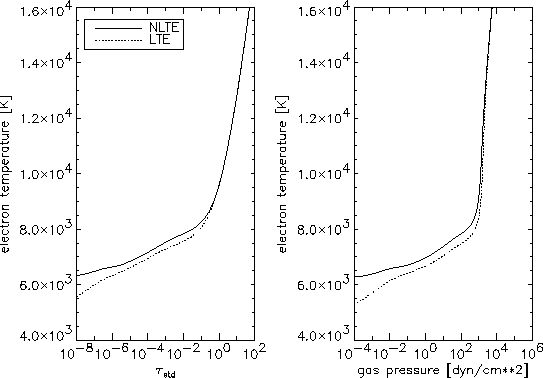
Figure:
Comparison between the NLTE and LTE
structure of PHOENIX solar
NLTE models.  is the optical depth in the continuum at
  .
.
 |
Figure:
Comparison between the Kitt Peak Solar Atlas
spectrum (thick curve) and the solar NLTE model (thin curve),
both reduced to a resolution of  . No attempts were made
to fine-tune the model. Terrestrial features (e.g.,
at about 0.75, 0.95 and
. No attempts were made
to fine-tune the model. Terrestrial features (e.g.,
at about 0.75, 0.95 and  m) were not removed from the
observed solar spectrum.
m) were not removed from the
observed solar spectrum.
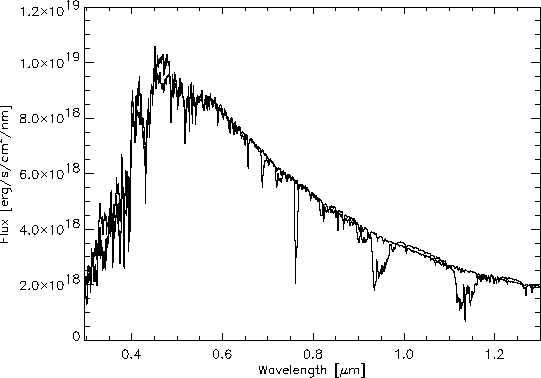 |
Figure:
Comparison between the Kitt Peak Solar
Atlas spectrum (thick curves) and the
solar NLTE model (thin curves) for selected
wavelength regions. Both spectra were smoothed to a resolution
of  . No attempts were made to fine-tune the model.
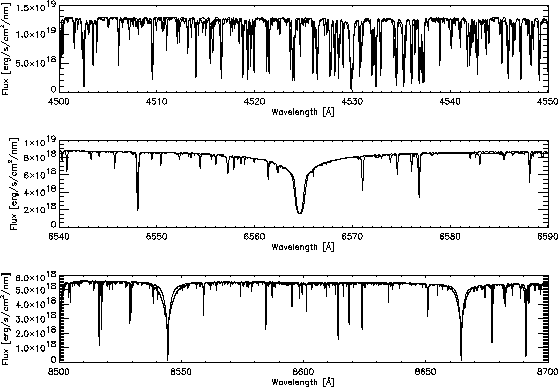 |
Figure:
Comparison between the NLTE and LTE
structure of PHOENIX solar
NLTE models as function of the height above 
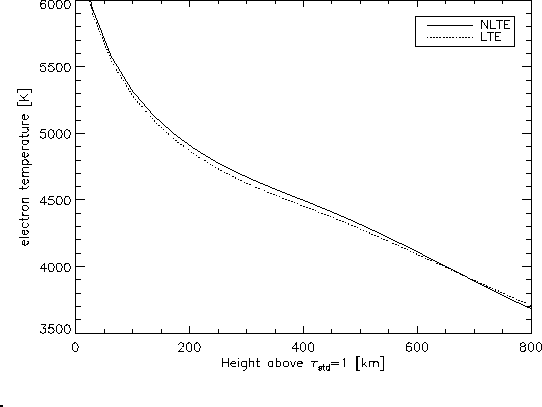 |
Figure:
Departure coefficients of the ground states
of selected ions as function of
(the optical depth in the continuum at ) for the solar model
with  and
and  .
.
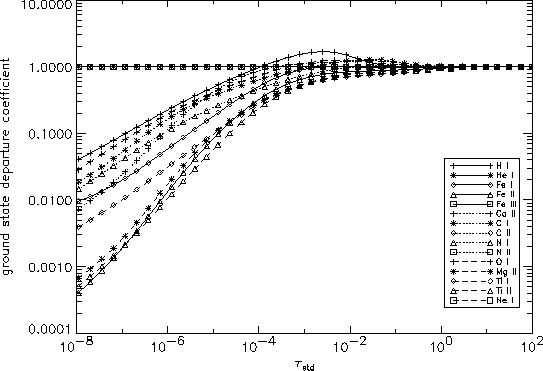 |
Figure:
Comparison between a PHOENIX Vega
NLTE model (dotted/thick line)
and Vega absolute spectrophotometry and IUE observational data. The model
parameters are given in the figure, the ``Vega abundances'' are taken
from [Castelli & Kurucz(1994)Castelli and Kurucz]. The model spectrum has been convolved with a
Gaussian kernel of  half-width to facilitate comparison with the
low resolution data.
half-width to facilitate comparison with the
low resolution data.
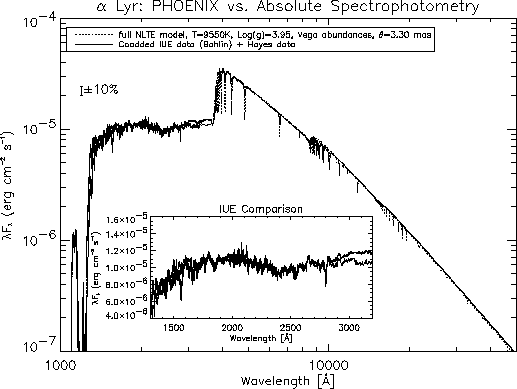 |
Figure:
Departure coefficients of the ground states
of selected ions as function of
(the optical depth in the continuum at ) for a Vega model
with  and
and  .
.
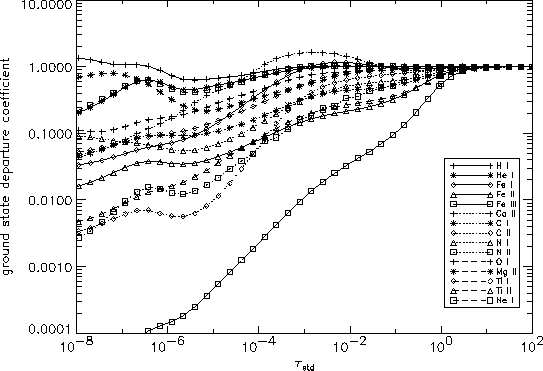 |
Figure:
Comparison between the NLTE and LTE
structure of PHOENIX Vega
NLTE models. is the optical depth in the continuum at .
 |
Next: About this document ...
Up: The NextGen Model Atmosphere
Previous: Tables
Peter H. Hauschildt
8/6/1998